A Short Story of Wall Street
January 23, 2014 by Gouthaman BalaramanA look at the volatility of the market from a historical perspective. This gives us a view of understanding market sentiment historically.
In the last couple of decades, the US market has witnessed a technology bubble, a housing bubble, recession, and market crashes. I wanted to understand the human sentiment, the fear when market crashes, the euphoria while riding the upside of the bubble. Here I narrate the story of wall-street from the view of short-term volatility.
Volatility
Volatility is a finance jargon for quantifying uncertainty over a window of time. If the window is small (like a week), then one can get a view of the market's reaction to day-to-day occurrences. On the other hand if we measure volatility using a larger window (such as a year), then a lot of the day-to-day noise dies out, and you get a macroscopic view of the market.
I wanted to understand how the market reacts to the crashes, and recessions. Do these things just happen out of the blue? Is there a lot of uncertainty, fear or excitement leading up to a market collapse? Is there a way to compare the latest market crash with those that have come before?
The Voice of Uncertainty
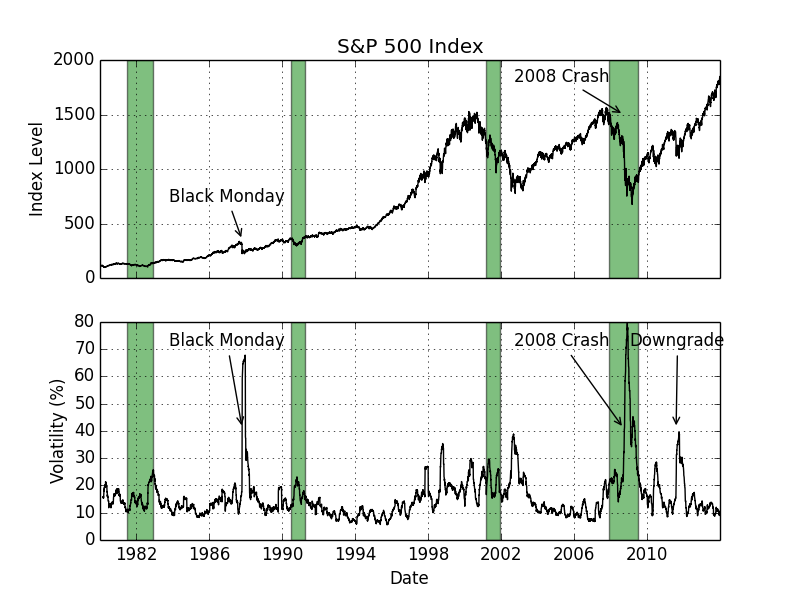
The picture above shows the S&P 500 index at the top, and its short-term volatility over the last 33 years. The last 33 years have gone through 4 recessions, the regions shaded in green. Here are some interesting observations:
- The markets prior to 1995 were less volatile, by about 24%, than post 1995. The average volatility was 14% for the time period of 1980 to 1995, in contrast with a 17.3% for the period 1995 to 2013.
- On pure percentage terms, the market crash on Black Monday (S&P 500 fell by 25.7% on Oct 19, 1987) was larger than the market drop in 2008 (21% drop in the week ending October 10, 2008). But the volatility paints a totally different picture. The uncertainty during 2008 market crash was roughly 20% more than that during the 1987 market crash.
- In August of 2011, the S&P downgraded US credit from AAA to AA+. This made the market volatile, and that is the little blip you see in 2011. The irony is, prior to 2008 crash, S&P had rated a some of the mortgage backed securities as high quality debt, even though a lot of them defaulted.
Methodology
I use S&P 500 to be representative of the stock market. The short term volatility is calculated by computing volatility using daily returns over a 45 day window.
finance equity
Related Post
- Calculating Stock Beta, Volatility, and More
- Valuing Options on Commodity Futures Using QuantLib Python
- Short Interest Rate Model Calibration in QuantLib Python
- Option Model Handbook, Part I: Introduction to Option Models
- Valuing Bonds with Credit Spreads in QuantLib Python

I am Goutham Balaraman, and I explore topics in quantitative finance, programming, and data science. You can follow me @gsbalaraman.

Updated posts from this blog and transcripts of Luigi's screencasts on YouTube is compiled into QuantLib Python Cookbook .